Skip to content
FREN Book a call
( Industry · Data · Semiconductors )( 06 / 08 )

HyperDrive for Galaxy

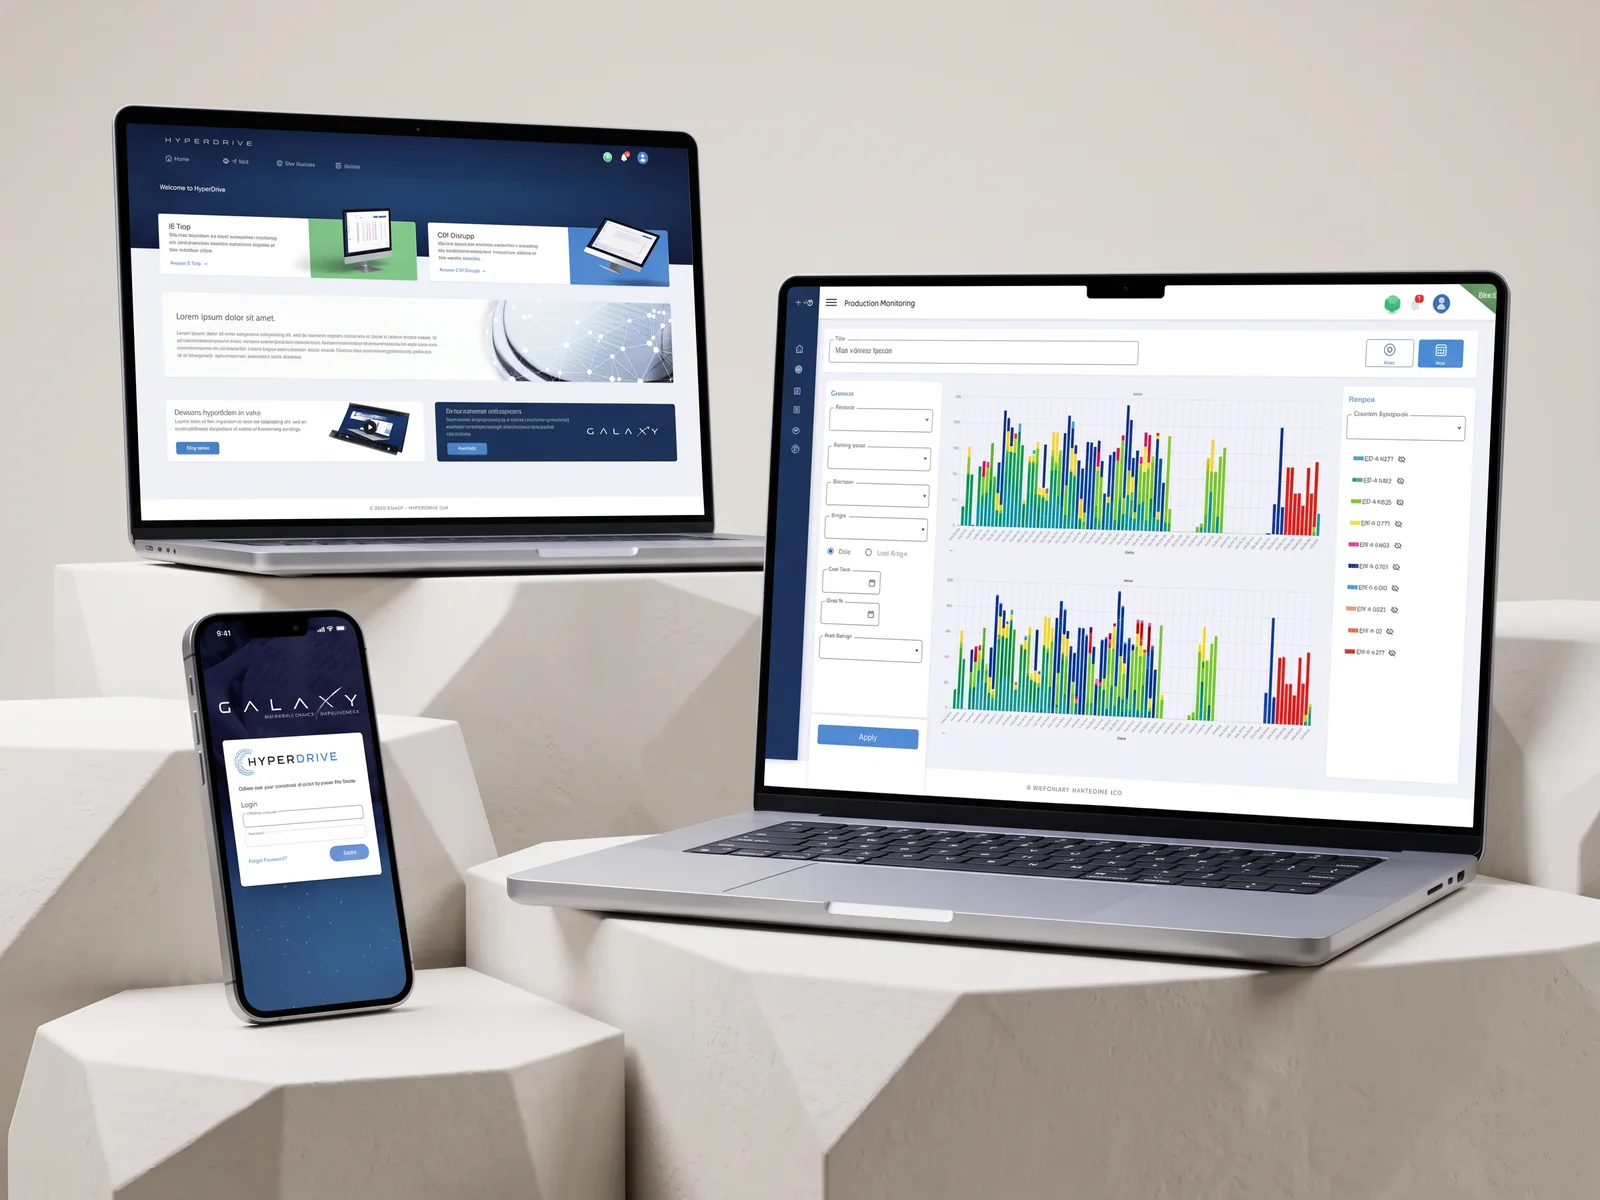
An analytics platform for semiconductor fabs: production monitoring, machine learning detection rules, statistical limits and a simulator. Dense screens for engineers who make fast decisions.An analytics platform for semiconductor fabs. Dense screens for engineers who make fast decisions.

· 2 min read · Industry · Data · Semiconductors

HyperDrive, a semiconductor production analytics platform, dashboards and rules
Galaxy Semiconductor Intelligence · Industry · Data · Semiconductorswww.galaxysemi.com

( Key facts )

HyperDrive is the production analytics platform of Galaxy Semiconductor Intelligence for semiconductor manufacturers. In 2023, Vladimir Spalaikovitch designed its UX/UI, design system and prototypes: production monitoring, ML and SPM rules, simulator.

Role
UX/UI design, design system, prototyping
Timeline
2023
Industry
Manufacturing, semiconductors, data
Scope
Home, production monitoring, ML rules, SPM rules, simulator, login
Stack
Figma, web application

The problem

Galaxy Semiconductor Intelligence provides semiconductor manufacturers with production analytics tools: circuit testing, process monitoring, drift detection. HyperDrive, its next-generation platform, had to bring production monitoring, machine learning detection rules, statistical limits and a simulator into a single interface, for process engineers and quality managers.

The challenge: very dense data, a large number of parameters, and an expert user base that tolerates neither slowness nor approximation.

My role

UX and UI design of the application: screen architecture, components, states, density rules, and prototypes for reviews with the product and engineering teams.

Key design decisions

A home screen that points the way

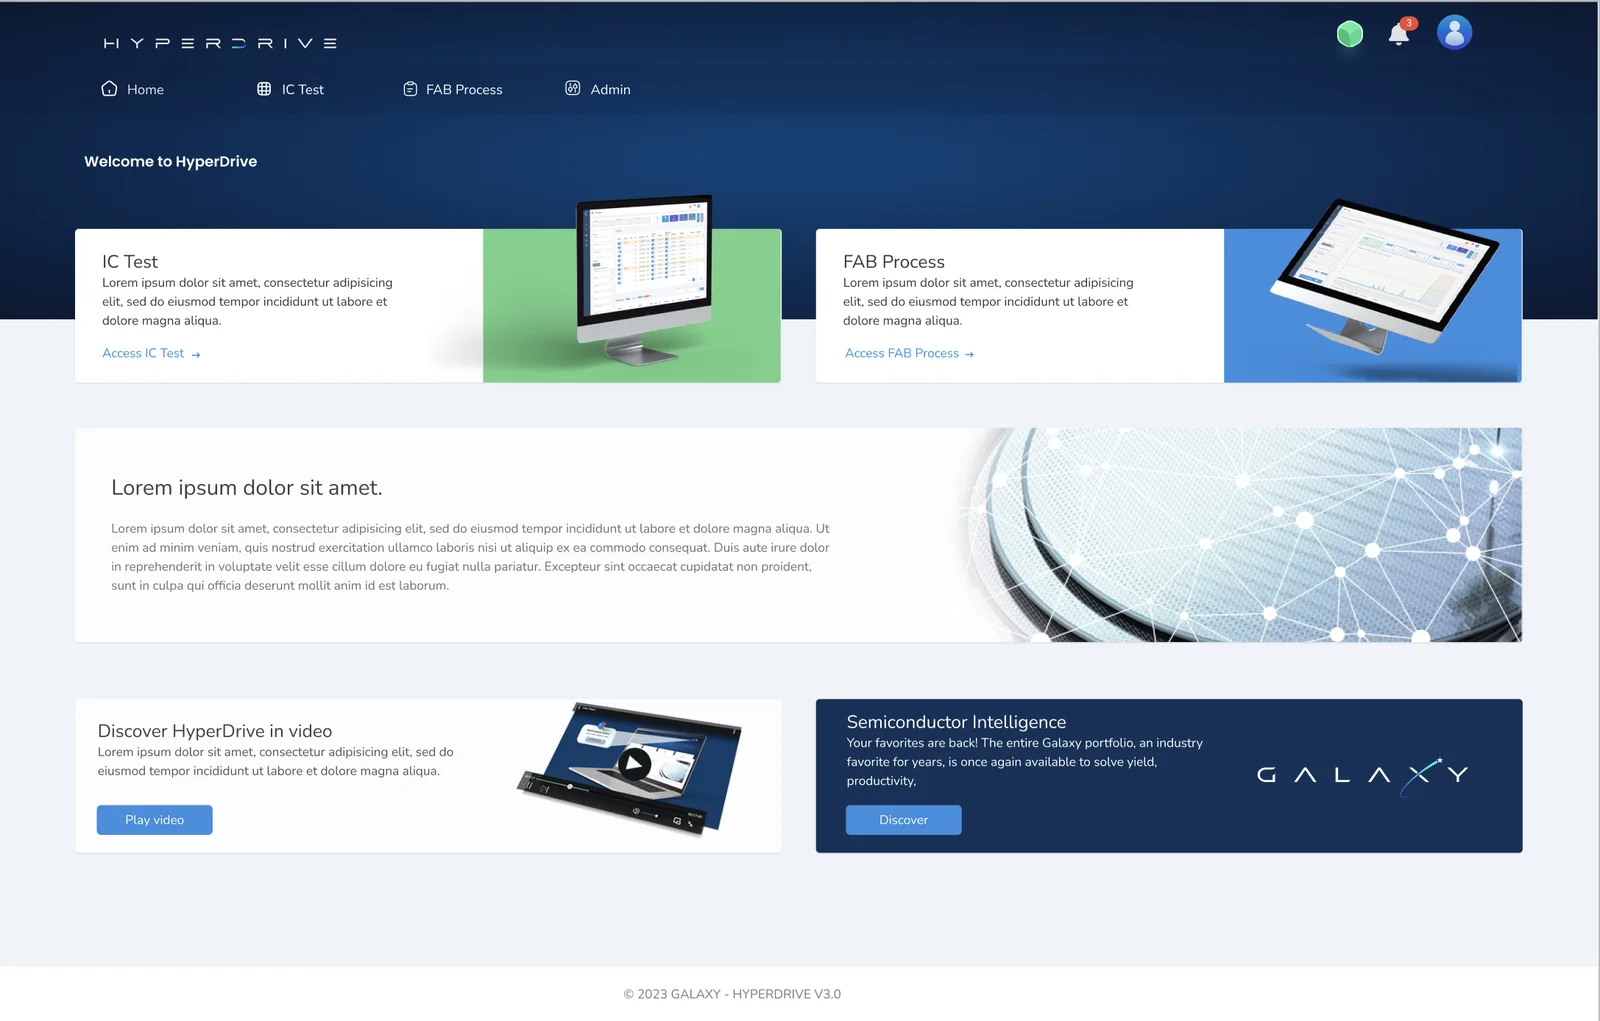
The home screen splits usage into clear entry points: circuit testing, manufacturing processes, administration, with direct access to features and a video walkthrough. Engineers know where to go at a glance.

The same skeleton everywhere

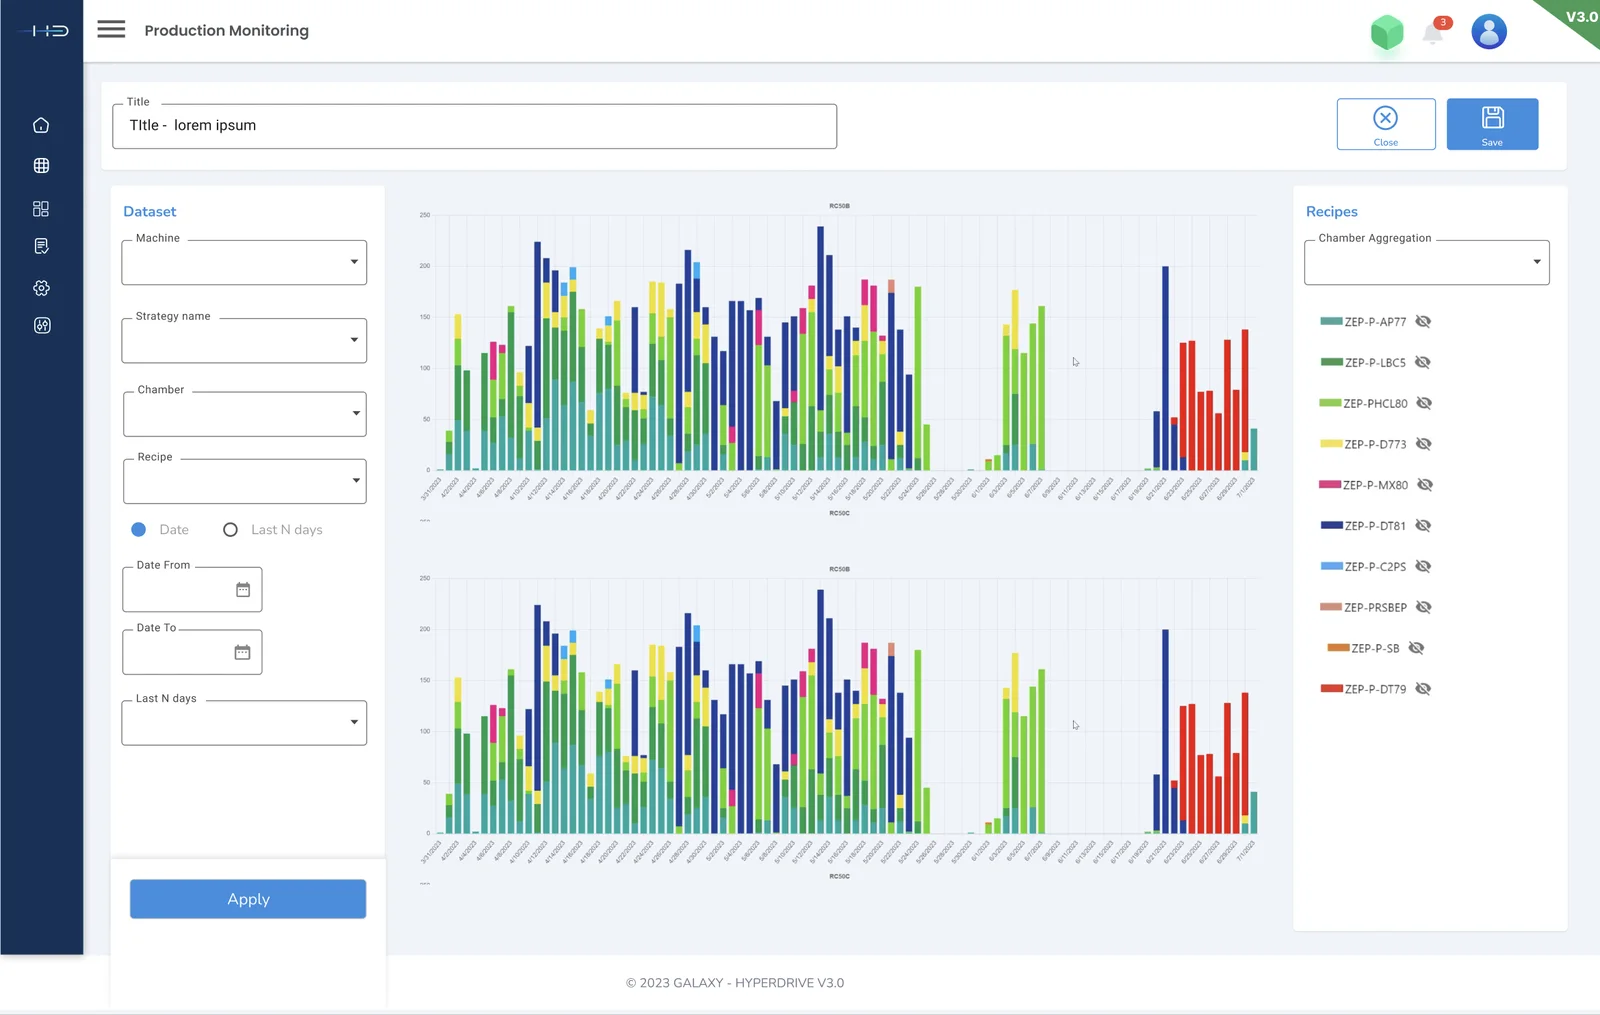
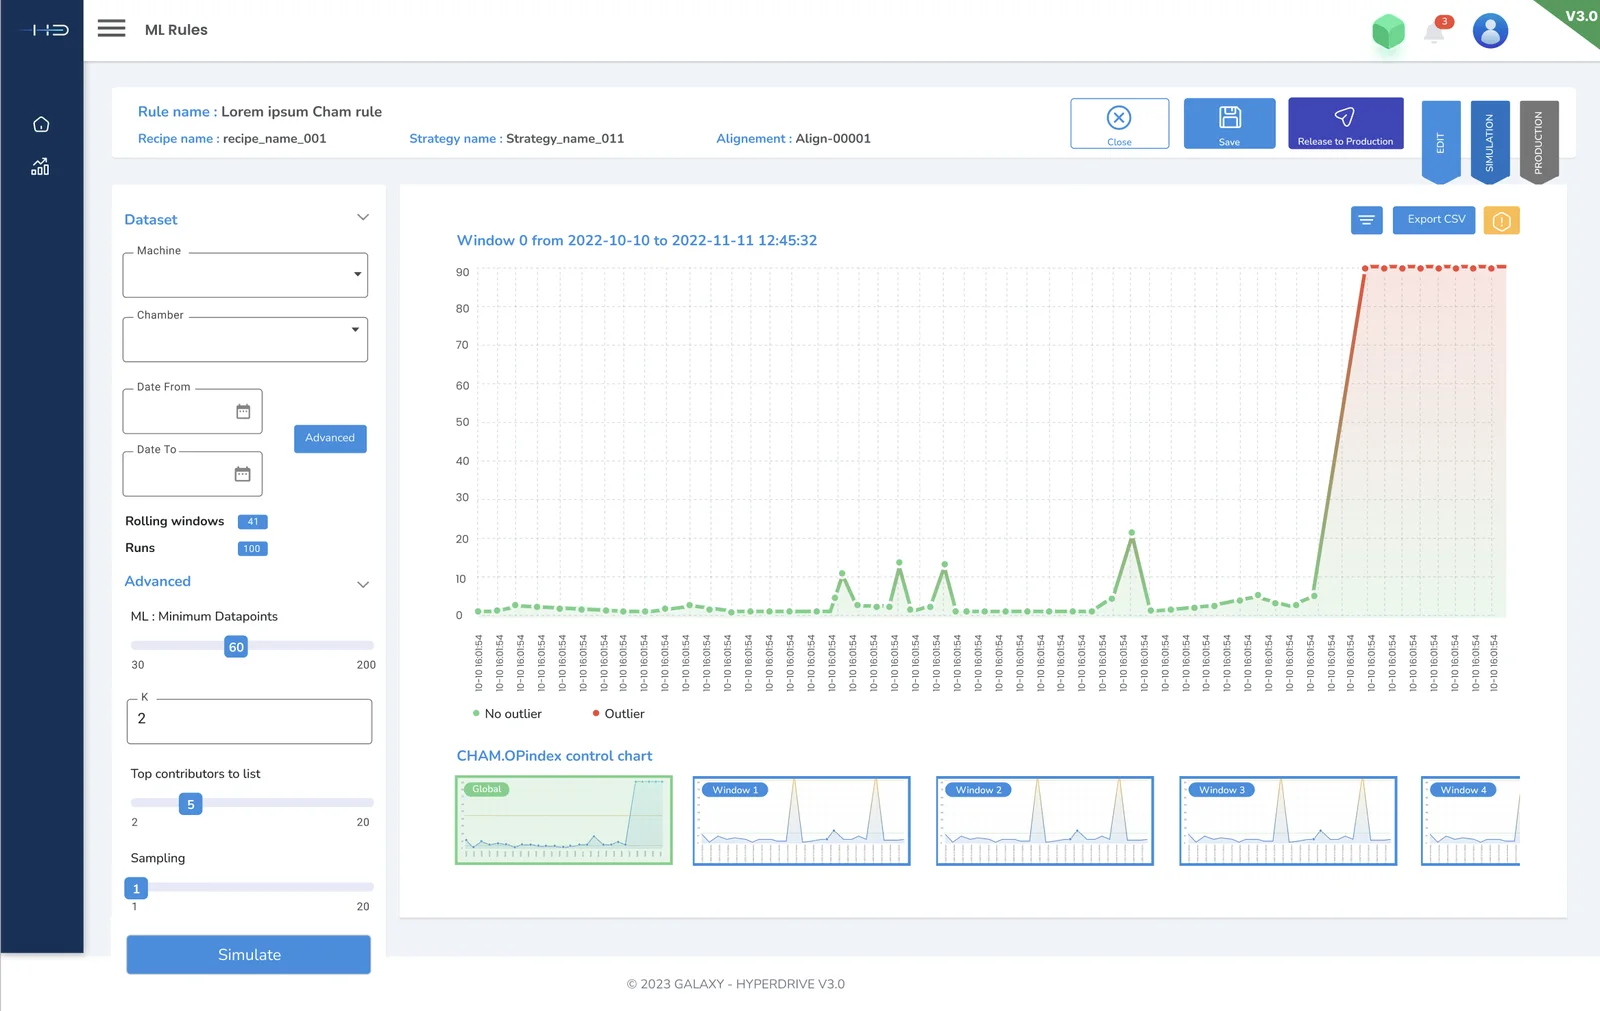
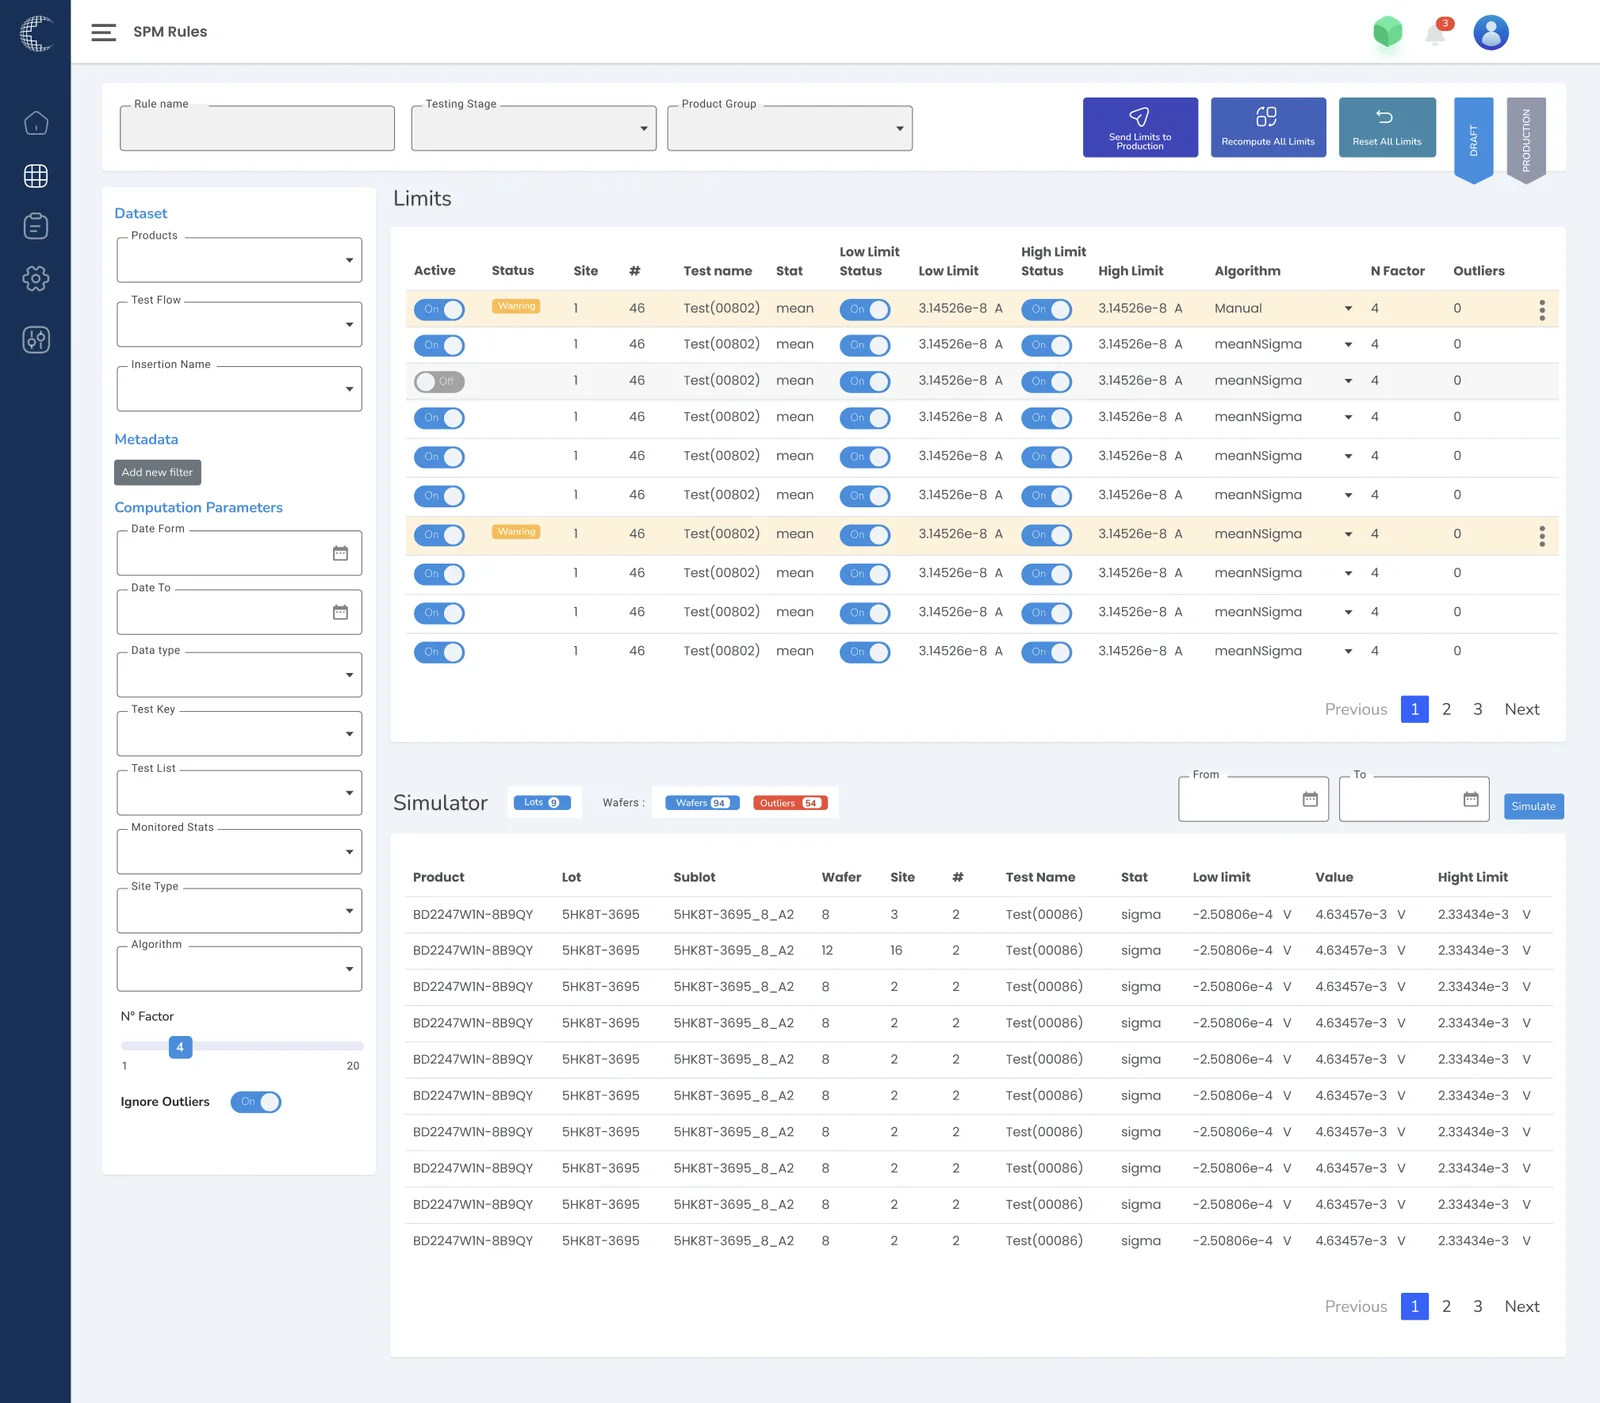
Production monitoring, ML rules, SPM rules: every screen follows the same structure. On the left, the dataset and its filters (tool, strategy, chamber, recipe, time range). In the center, the visualization. On the right or at the top, the actions: save, simulate, push to production. Learn one screen and you know all three.

Charts built for reading, not decoration

Stacked bars by recipe for monitoring, sliding window curves with outlier detection for ML rules, control chart thumbnails to compare windows. Colors are assigned to recipes and stay consistent from one screen to the next.

Limits tables you can work with

The SPM screen lines up dozens of low and high limit rows with status, algorithm, factor and outliers, each one toggleable. The simulator right below shows the effect of a setting on lots and wafers before it is applied. One primary action per block, explicit states, no ambiguity about what is in production.

A login that sets the tone

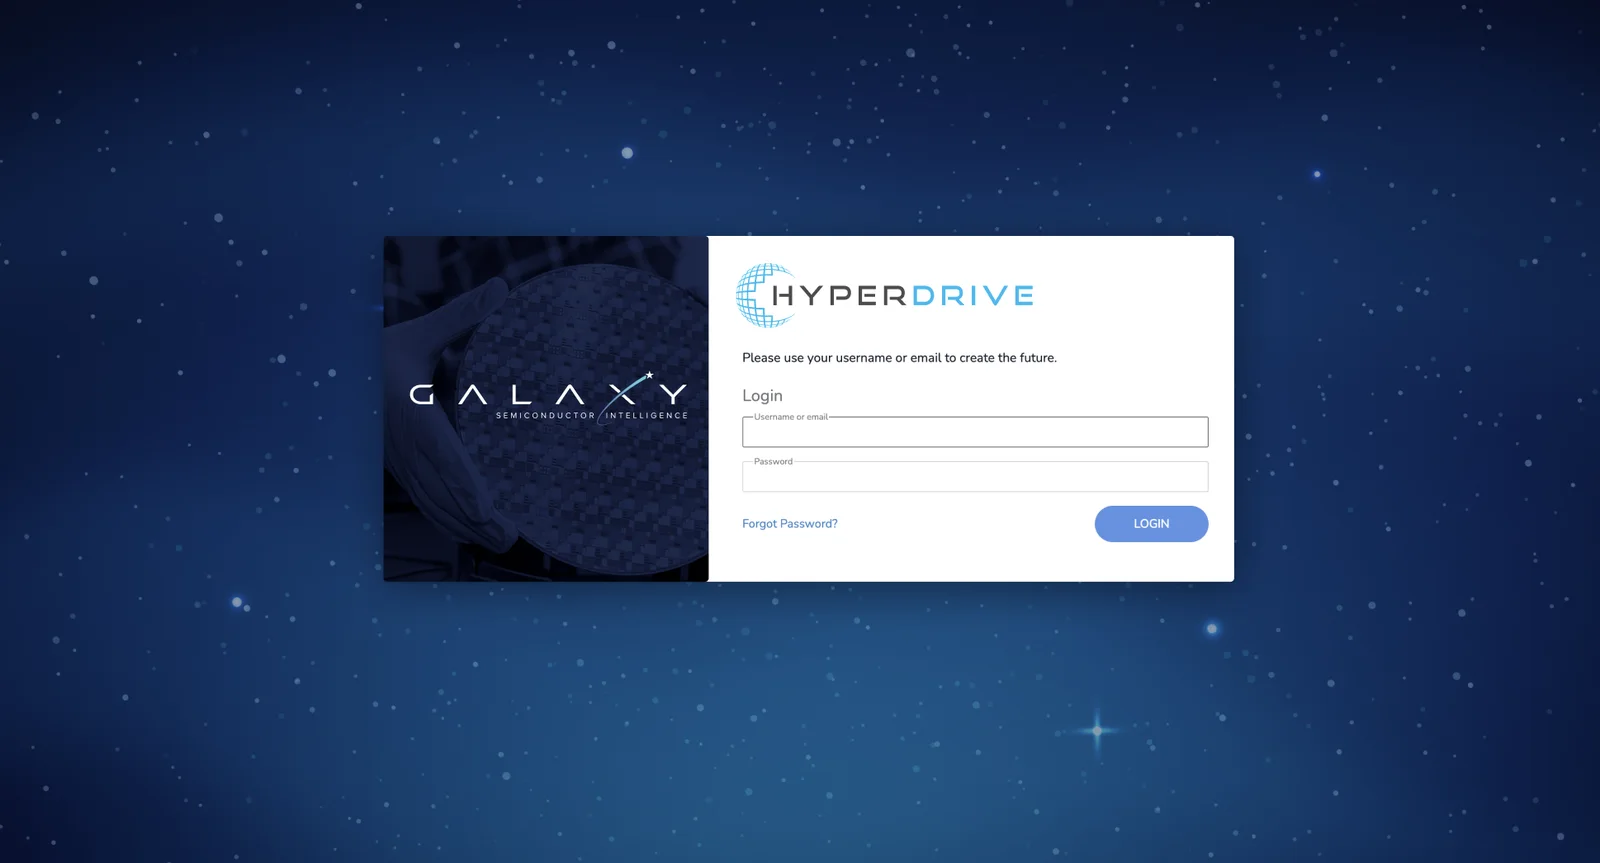
The login page places the HyperDrive and Galaxy brands over a wafer image: the only concession to imagery in an application otherwise entirely devoted to data.

Takeaways

  • In an expert tool, structural consistency matters more than any originality.
  • Density is managed with filters and states, never by shrinking the font size.
  • A simulator right next to the settings prevents most production errors.

Expertise involved: UX/UI for complex tools, design system, UX strategy.
( Gallery · 05 )

The project in screens

HyperDrive for Galaxy · Home: three entry points, circuit testing, processes, administration
01Home: three entry points, circuit testing, processes, administration
HyperDrive for Galaxy · Production monitoring: dataset filters and stacked bars by recipe
02Production monitoring: dataset filters and stacked bars by recipe
HyperDrive for Galaxy · ML rules: sliding windows and outlier detection
03ML rules: sliding windows and outlier detection
HyperDrive for Galaxy · SPM rules: limits table and simulator
04SPM rules: limits table and simulator
HyperDrive for Galaxy · HyperDrive login over a wafer image
05HyperDrive login over a wafer image
( Next · 05 )

Keep reading

  1. Climeet

    Climeet case study: art direction, a Figma design system and React prototyping for an app that measures the carbon footprint of events, plus its website.Art direction, design system and React prototype for a carbon footprint app.Event tech · Carbon · Design systemRead
  2. UX/UI for B2B SaaS

    B2B SaaS UX/UI designer: onboarding, dashboards, data, back offices, pricing, white label. Cofounder and CPO of a SaaS, 20 years designing business tools.SaaS UX/UIRead
  3. Design system

    Design system design: tokens, Figma and code components, documentation and governance, for teams that want to ship faster and stay consistent. Let's talk.Design SystemsRead
  4. UX/UI audit

    UX/UI audit by a senior designer: expert review of user flows, accessibility and design system, with a prioritized, costed action plan. Two weeks, actionable.Senior UX/UI audit: flows, accessibility, prioritized action plan in two weeks.AuditRead
  5. B2B SaaS UX: ten principles I learned building my own

    Ten B2B SaaS UX principles learned by co-founding a SaaS company: first value, one action per screen, real data, useful errors, clear pricing, measurement.Ten B2B SaaS UX principles, learned by co-founding a SaaS company. · 3 minRead